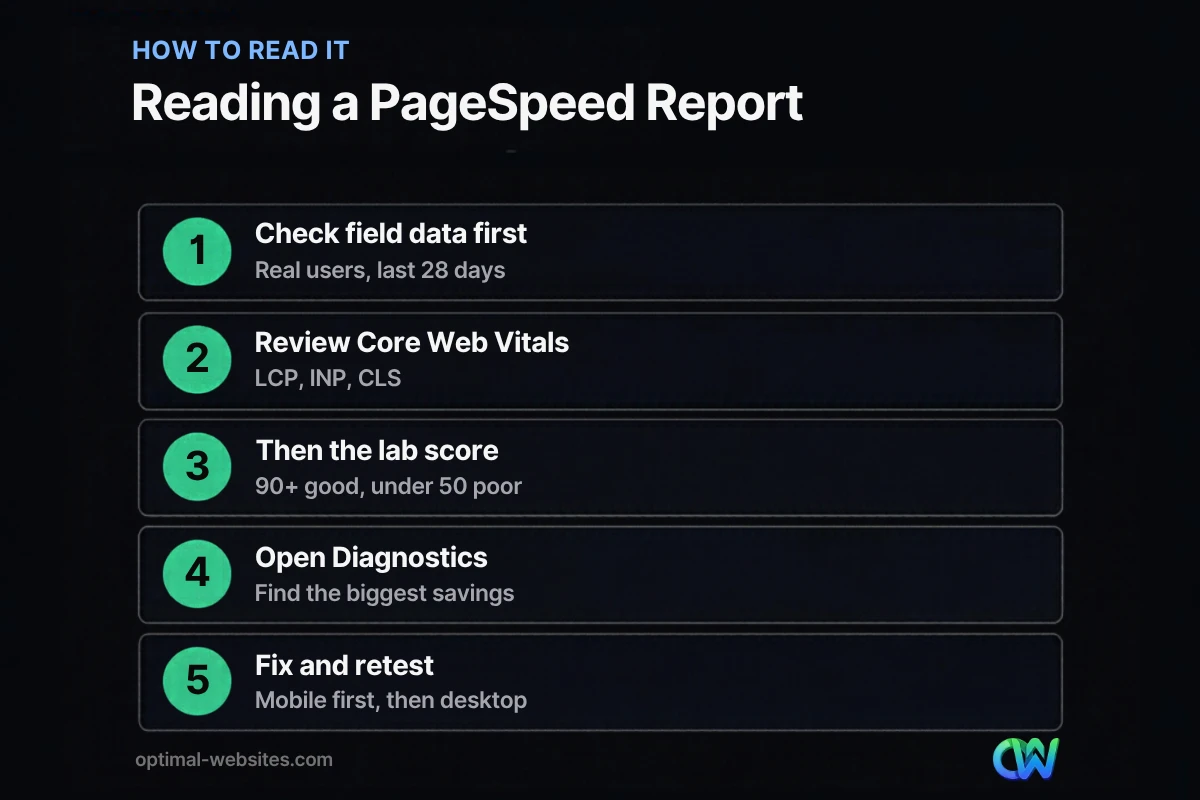
Quick answer: PageSpeed Insights is Google’s free tool for measuring how fast a page loads and responds. Read it in this order: field data first (what real visitors experienced over the last 28 days), then the Core Web Vitals assessment, then the lab performance score and its diagnostics. Fix the issues with the largest estimated savings, starting on mobile.
You ran your website through PageSpeed Insights, saw a red or orange number, and now you are not sure whether to panic. The report is packed with metrics, colored badges and technical suggestions like “reduce unused JavaScript,” and it is easy to focus on the wrong thing. That matters because a slow site costs leads, and fixing the wrong problems costs money. This guide explains how to read PageSpeed Insights step by step, what the score really means, the difference between lab and field data, and which fixes are worth your time on a typical small business WordPress site.
Key Takeaways
- PageSpeed Insights shows two kinds of data: field data from real Chrome users and lab data from a simulated test.
- Field data and the Core Web Vitals assessment reflect real visitor experience; the 0 to 100 performance score is a lab estimate.
- A lab score of 90 or above is good, 50 to 89 needs improvement, and below 50 is poor.
- Scores vary between runs, so test several times and look for patterns rather than chasing a single number.
- Prioritize fixes with the largest estimated savings, usually images, render-blocking code and heavy third-party scripts.
What is PageSpeed Insights?
PageSpeed Insights (PSI) is a free Google tool that reports on the performance of a web page on mobile and desktop and suggests how to improve it. You enter a URL at PageSpeed Insights and get a report in under a minute.
The report combines two sources. Field data comes from the Chrome User Experience Report (CrUX), which collects anonymized performance data from real Chrome users. Lab data comes from Lighthouse, an automated tool that loads your page in a simulated device and network. Understanding the difference is the key to reading the whole report.
What is the difference between lab and field data?
Field data shows what real visitors experienced; lab data shows what happened in one controlled test. Field data is the better measure of real experience, while lab data is better for diagnosing problems.
According to Google’s PageSpeed Insights documentation, lab data is collected in a controlled environment and is useful for debugging, but may not capture real-world bottlenecks. Field data captures true real-world experience over the previous 28-day collection period.
| Field data | Lab data | |
|---|---|---|
| Source | Real Chrome users (CrUX) | Lighthouse simulated test |
| Time period | Previous 28 days | A single test run |
| Shows | Core Web Vitals assessment | Performance score and diagnostics |
| Best for | Knowing how real visitors experience the site | Finding and debugging specific issues |
| Available for | Pages and sites with enough traffic | Any public URL |
Small business sites often see “no data” in the field section because there is not enough Chrome traffic to report. In that case, rely on the lab results and your own testing on real phones.
How do you read the Core Web Vitals assessment?
The Core Web Vitals assessment is a pass or fail based on real-user data for three metrics: Largest Contentful Paint (LCP), Interaction to Next Paint (INP) and Cumulative Layout Shift (CLS). To pass, the 75th percentile of each metric must be in the “good” range.
The Core Web Vitals thresholds on web.dev define good as:
- LCP of 2.5 seconds or less: how quickly the main content, usually a hero image or headline, appears.
- INP of 200 milliseconds or less: how quickly the page responds to taps, clicks and key presses. INP replaced First Input Delay as a Core Web Vital in March 2024.
- CLS of 0.1 or less: how much the layout jumps around while loading.
The 75th percentile means at least three out of four visits should meet the threshold. Our Core Web Vitals guide explains each metric in more depth.
What does the PageSpeed score mean?
The PageSpeed score is a 0 to 100 lab score calculated by Lighthouse from several performance metrics in a simulated test. It is a useful health check, but it is not the same as your Core Web Vitals result and it does not include field data.
Google’s documentation groups scores into three bands:
- 90 to 100: good
- 50 to 89: needs improvement
- 0 to 49: poor
Scores also change between runs even when nothing on the page changed, because of network conditions, hardware and other factors. Run the test three times and use the typical result. A mobile score in the 70s with passing Core Web Vitals is usually healthier than a 95 in the lab with failing field data.
Why is my mobile score lower than desktop?
Mobile scores are almost always lower because the lab test simulates a mid-range phone on a slower connection. Desktop tests assume a faster machine and network.
Do not ignore the mobile result. Most local service searches happen on phones, and the mobile experience is what many of your customers actually get. If you have to pick one tab to improve first, pick mobile.
Which PageSpeed Insights recommendations should you fix first?
Fix the items with the largest estimated savings that affect your Core Web Vitals, starting with LCP. On most small business sites, a handful of issues cause most of the slowdown.
Diagnostics worth fixing first
- Large or unoptimized images. Resize images to their display size, compress them and use modern formats like WebP. Do not lazy-load the main hero image, because that delays LCP.
- Render-blocking resources. CSS and JavaScript that load before content can delay the first paint. Defer non-critical scripts and remove what you do not use.
- Heavy third-party scripts. Chat widgets, tracking pixels, embedded maps and video players often add more weight than the page itself. Load them only where needed, or after interaction.
- Slow server response. A slow time to first byte points to hosting or caching problems. Page caching and quality hosting help.
- Too many fonts. Each font family and weight adds requests. Limit fonts and preload the ones used above the fold.
- Layout shifts. Set width and height on images and reserve space for banners and embeds to keep CLS low.
Diagnostics you can usually skip
Some suggestions offer tiny savings or are hard to fix without rebuilding the site. If an item shows only a few milliseconds of estimated savings, move on. Your time is better spent on the big items above.
For a full step-by-step approach, see our guide on how to improve website speed.
How do you use PageSpeed Insights on a WordPress site?
Test your most important pages, not just the homepage, and retest after each change so you know what helped. WordPress sites usually slow down because of plugins, page builder bloat, unoptimized images and weak hosting.
A simple routine:
- Test the homepage, your top service page and your contact page on mobile.
- Note the field data (if available), the Core Web Vitals result and the lab score.
- Make one change at a time: image compression, caching, removing an unused plugin.
- Clear your cache, wait a minute, and retest three times.
- Re-check field data over the next 28 days to confirm real visitors see the improvement.
If your WordPress site is slow everywhere, our post on fixing a slow WordPress site covers hosting, plugins and builder settings in detail.
What we see when testing small business websites
When we run PageSpeed Insights on websites for contractors, law firms and local service companies, the same few problems account for most poor scores: oversized hero images or sliders, several tracking and chat scripts loading on every page, and too many plugins doing overlapping jobs.
On the sites we build with WordPress and Elementor Pro, we compress and properly size images, keep fonts and scripts lean, use caching, and test key pages on mobile before launch. We focus on passing Core Web Vitals and on real-world speed on a phone, not on chasing a perfect 100 that does not change how fast customers can call you.
How Optimal Websites Can Help
Optimal Websites, a WordPress web design agency based in Delaware, offers a website speed optimization service for small business sites. We read your PageSpeed Insights and Search Console data, fix the issues with the biggest impact, and document what changed so you can see the before and after.
If your site needs more than a tune-up, request a free quote and we will tell you whether optimization or a rebuild makes more sense.
Frequently Asked Questions
What is a good PageSpeed Insights score?
A PageSpeed Insights performance score of 90 or above is considered good, 50 to 89 needs improvement, and below 50 is poor. The score is a lab estimate, though. Passing Core Web Vitals in field data matters more for real visitors, so check that assessment before worrying about a few points on the score.
Why does my PageSpeed score change every time I test?
PageSpeed scores vary between runs because the lab test is affected by network conditions, server response, hardware and resource contention, even when nothing on the page changed. Run the test three times and use the typical result. Look for consistent patterns in the diagnostics rather than reacting to one unusually high or low score.
What is the difference between PageSpeed Insights and Lighthouse?
Lighthouse is the lab testing tool that produces the performance score and diagnostics. PageSpeed Insights runs Lighthouse for you and also adds field data from real Chrome users through the Chrome User Experience Report. That combination of lab vs field data makes PSI the better starting point for most business owners.
Why does PageSpeed Insights say no data for my site?
The “no data” message in the field section means Google does not have enough real Chrome user data for that page or site over the last 28 days. This is common for small business websites. Use the lab results to find issues, test on real phones, and check Google Search Console’s Core Web Vitals report as traffic grows.
Does PageSpeed Insights affect SEO?
PageSpeed Insights itself does not affect SEO; it is a measurement tool. What it measures does matter: Core Web Vitals are part of Google’s page experience signals, and slow pages tend to lose visitors before they convert. Treat speed as one factor alongside helpful content and relevance, not a guaranteed ranking boost.
Should I aim for a perfect 100 PageSpeed score?
No. A perfect 100 is rarely necessary and can require removing useful features. Aim to pass Core Web Vitals in field data and keep your mobile lab score in a healthy range. For most small business sites, fast loading on a real phone and an easy path to call or request a quote matter far more than the last few points.
Ready to Get Started?
Want help turning a red PageSpeed report into a fast site? Get a free quote or call (302) 554-9497, and we will review your results with you.